


An environmental engineer by education, Radhica has worked on environmental management and corporate responsibility spanning across water, wastewater and air. She has worked extensively on integrated urban water management models as well as rural water and sanitation and household water security. She also has significant experience in air quality management, working at the U.S. EPA in a regulatory capacity. She has 18+ years’ experience in environment and sustainability and solving on-the-ground environmental issues, working for organizations in India as well as in the US, such as TERI, Arghyam and U.S EPA. She is passionate about innovation and has worked and supported innovations that solve environmental issues. She currently heads Design and Development in air pollution control at a green-tech startup called Devic-Earth. She is also the Founder of Kapokseed Innovation Platform, a platform that encourages innovation in environmental sustainability.
The assumption is that industrial activities are high contributors to air pollution, but recent studies held during the lockdown suggest human activities including transportation may have a far higher impact on air quality. Here we talk about emissions in industrial and metro cities, their impact and where these findings take us.
The COVID-19 lockdown over the past months has revealed the extent of human impact on the environment.
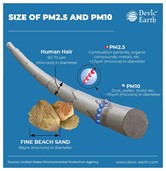
Human activities such as transportation, industrial activity, urbanization, etc. have an adverse impact upon climate change, and in particular on air quality. One of the most common pollutants, particulate matter or PM (PM2.5 and PM10), is also among the most dangerous. To study the distribution of PM over the periods of lockdown and before, 8 representative cities (metros and industrial cities) along the Indo-Gangetic Plain have been analyzed.
Impact Upon Different Types Of Cities
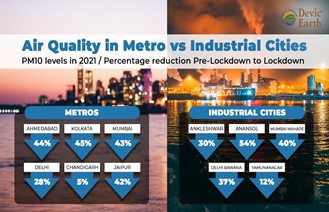
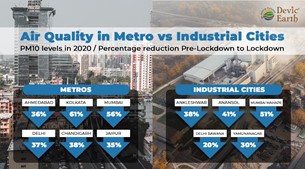
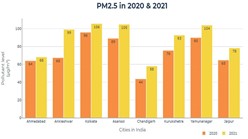
Air pollution levels in metro cities as opposed to industrial cities were analyzed. Contrary to assumptions, the impact of air pollution on metro cities is far greater than its impact on industrial cities. Recent data from CPCB CAAQMS monitors at metro and Tier II cities shows that average levels of PM2.5 and PM10 during festival periods surpass the pollution levels from industrial cities. Since India has a highly vaccinated population against the COVID-19 virus, there was much increase in vehicular movement and other activities during the festive season. This increased pollution levels in metro and tier-II cities.
Methodology – Air quality data for Indian cities including Mumbai, Kolkata, Ahmedabad, Chandigarh, and Jaipur was sourced from the Central Pollution Control Board (CPCB).
Cities Selected for Study
To assess the air quality over India during the lockdown in 2020 and 2021, the data for 24-hour average daily concentrations of pollutants were collected for 2020 and 2021, for the following cities:
| Cities | State | Location | Type |
| Kurukshetra | Haryana | UGP | Metro Tier II |
| Yamuna Nagar | Haryana | UGP | Industrial |
| Chandigarh | Haryana/Punjab | UGP | Metro Tier II |
| Asansol | West Bengal | LGP | Industrial |
| Kolkata | West Bengal | LGP | Metro Tier I |
| Ahmedabad | Gujarat | UGP | Metro Tier I |
| Ankleshwar | Gujarat | UGP | Industrial |
| Jaipur | Rajasthan | Northwest Arid | Industrial/Metro Tier II |
Broad Profile of Selected Cities
| Tier | I and II |
| Geography | Along Indo-Gangetic Plain |
| Type | Metros and Industrial Cities |
Time Profile
| 2020 (Lockdown 1) | Pre lockdown period | Feb 24 – Mar 24 |
| Lockdown period | Mar 25 – May 3 | |
| 2021 (Lockdown 2) | Pre lockdown period | Mar 28 – April 28 |
| Lockdown period | April 29 – May 29 |
Note: In 2020, the country saw a complete lockdown of all cities and industries, except those operating essential services. This period witnessed massive reductions in air pollution levels. However, in 2021, cities saw almost a complete lockdown, whereas industries were mostly running albeit with limited production.
Profile of Pollutants Studied
Particulate Matter – PM2.5 and PM10
City Specific Results
I
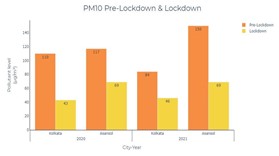
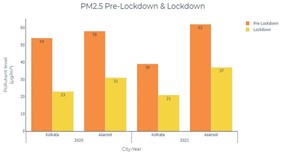
KOLKATA Asansol
Kolkata is a metro while Asansol is an industrial city. Their respective sources of emissions are different, and so are the reductions in pollution levels.
- During Lockdown 1 (in 2020), Kolkata saw a 57% reduction in PM2.5 levels and a 61% reduction in PM10 levels.
- On the other hand, Asansol saw 47% reduction in PM2.5 and 41% reduction in PM10.
- During Lockdown 2 (in 2021), the difference is less stark. While Kolkata saw a 46% reduction in PM2.5, Asansol saw a 40% reduction in PM2.5.
Observation: In this case, pollution reduction was greater in the metro than the industrial city.
II
MUMBAI Mahape
The MIDC Industrial area, located in Mahape(Navi Mumbai), has industries ranging from paper mills to heavy machinery.
- Mumbai and Mahape show almost equal reductions of PM2.5 and PM10.
- There is a slightly higher reduction of pollutants during Lockdown 1, possibly because 2020 saw a complete lockdown compared to 2021.
Observation: It is possible that industrial emissions are an equal contributor to Mumbai’s air pollution, as vehicular emissions.
III
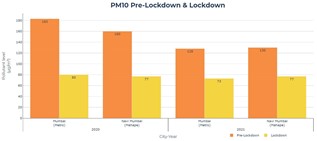
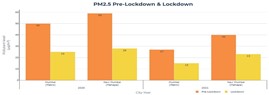
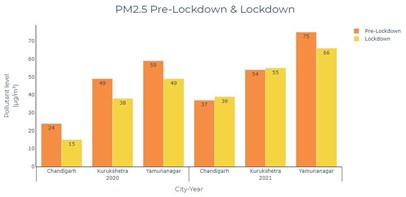
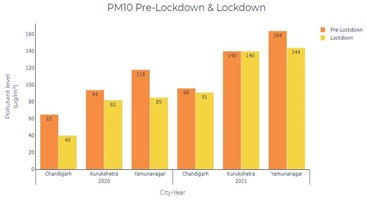
CHANDIGARH Yamunanagar – Kurukshetra
In this belt, Chandigarh is a Tier II metro city, Yamunanagar is industrial, and Kurukshetra is a mix of the two.
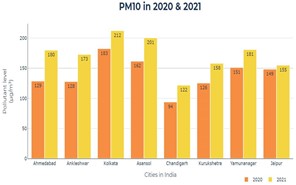
- During Lockdown 1, Chandigarh recorded the highest decrease in PM2.5 at 38%, while Kurukshetra recorded a PM2.5 reduction of 22% and Yamunanagar recorded a PM2.5 reduction of 17%.
- Lockdown 2 in all three cities seemed to be partial, as reductions were non-existent.
Observation: The metro region recorded a higher reduction than the industrial area.
IV
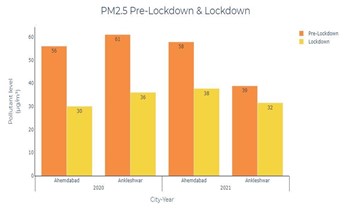
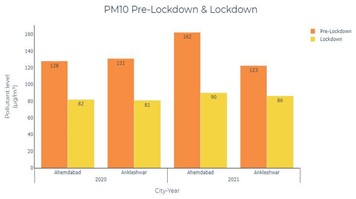
AHMEDABAD Ankleshwar
Ahmedabad is a metro and Ankleshwar is an industrial city.
- In Lockdown 1, Ankleshwar recorded a PM2.5 decrease of 40%, whereas Ahmedabad recorded a PM2.5 decrease of 46%.
- In Lockdown 2, Ankleshwar recorded a PM2.5 decrease of 18% and Ahmedabad recorded a PM2.5 decrease of 34%.
- During Lockdown 1, about 950 industrial units were in operation during the pre-lockdown period in Ankleshwar. Once the lockdown was imposed, only 46 units were open – mainly pharmaceuticals and sanitizer manufacturing facilities[1].
- During Lockdown 2, however, it appears that the manufacturing activity picked up and emissions were not significantly different between pre-lockdown and lockdown periods.
JAIPUR
Jaipur has a mix of residential and industrial areas.
- During Lockdown 1, PM2.5 reduced by 41% and PM10 reduced by 35%.
- During Lockdown 2, reductions were similar – 36% decrease in PM2.5 and 27% decrease in PM10.
Observation: This indicates that the restrictions were not implemented completely, and there was no slowing down of economic activity.
CONSOLIDATED FINDINGS
Tier 1 cities saw a higher reduction in pollution than Tier 2 cities. This could be because Tier 1 cities may have had a complete and enforced lockdown, and therefore a vaster reduction in economic activity.
The reduction of particulate matter is higher in the metro cities that are primarily residential, than in cities that are primarily industrial.
Industries were probably still operating at reduced capacity through the lockdown, but importantly, the movement of people and goods is a significant contributor to particulate matter. There is tremendous improvement to air quality when economic activity is cut down.
Conclusion
Evidently, the respite in air pollution over the lockdown has not made enough of an impact in policy. Policy makers need to offer an alternate solution for livelihood by working with changemakers and advocacy groups to offer sustainable alternatives.